How to run a website speed test with GTmetrix
Having a fast website comes with many potential benefits, such as a higher position on the SERPs and a better chance to make your visitors stay longer. You can check if your site is performing well by using site speed testing tools like GTmetrix. It will show you various parameters that will help identify what is slowing down your site and how to fix those issues.
To get a grasp on how it works, here’s everything you need to know about GTmetrix.

What is GTmetrix
GTmetrics is one of the most popular tools for analyzing site speed performance. If you put a website to the test, it will provide a performance score and a report which shows the current state of the site along with some suggestions on what can be improved.
This tool comes with two sets of plans – one set is aimed at individual use and the other one is for businesses. The price for individual plans start at $4.25/month, while the plans for businesses begin at $72.50/month.
Another thing worth mentioning is how GTmetrix incorporates results from Google PageSpeed Insights and YSlow to form the performance score and recommendations. With this, you don’t have to perform the test on another tool since the results cover a wide spectrum of performance metrics and present them comprehensively.
Before you run a speed performance test in GTmetrix, there are some factors that you need to consider. Let’s take an in-depth look!
What to consider when conducting a website speed test
It’s essential to make sure that the test’s results are accurate and relevant. After all, a precise result will help you make an informed decision on what will help improve your site’s speed.
To improve the accuracy of the test, you should pay attention to these factors:
- The number of tests – it’s not enough to do a one-time test since the results might change based on the amount of traffic. Try repeating the test at different times.
- Test locations – if you have a local audience, you might want to set the location of the test to the one nearest to your visitors. If you target global audiences, you should do the test with multiple regions around the globe.
- Test subjects – test multiple posts and pages for a better analysis. This will help find out which need to be optimized.
Keep in mind that the primary goal when optimizing your website is to improve the entire site’s performance rather than the performance score. You have to take each suggestion in the report into account to decide which will make the largest positive impact.
How to run a speed test with GTmetrix
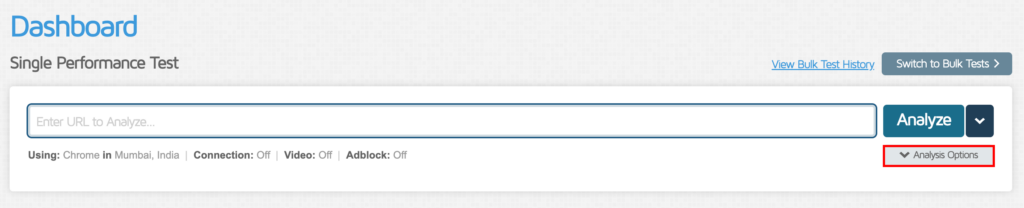
GTmetrix is easy to use – just type in the URL you want to test, and you’re ready to go. But before doing that, you might want to change the test’s configuration. Just click on the Analysis Options button below the Analyze button. It will only be available if you’re signed into a GTmetrix account. Without it, you won’t be able to change the region or other options.
When you’re logged in, you are free to use the 30 test servers scattered across seven regions:
- Vancouver, Canada
- San Antonio, USA
- São Paulo, Brazil
- London, UK
- Mumbai, India
- Hong Kong, China
- Sydney, Australia
You can also test site performance with specific browsers like Chrome, Firefox, or mobile browsers.
Additionally, you can test with different connections.

There are also additional options, such as showing a video of how the page loads or preventing ads from loading on the tested page. You can also set the test to stop at window Onload – exactly when the processing of the page has completed.
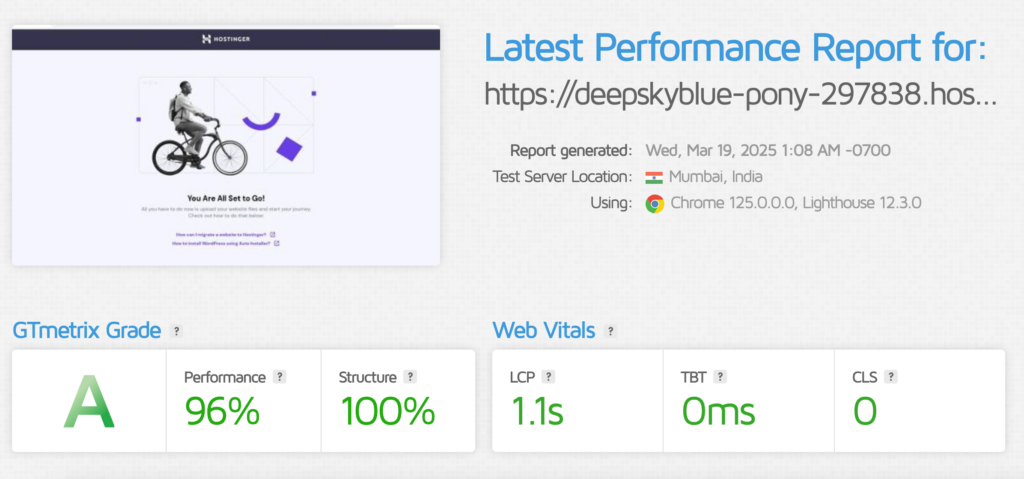
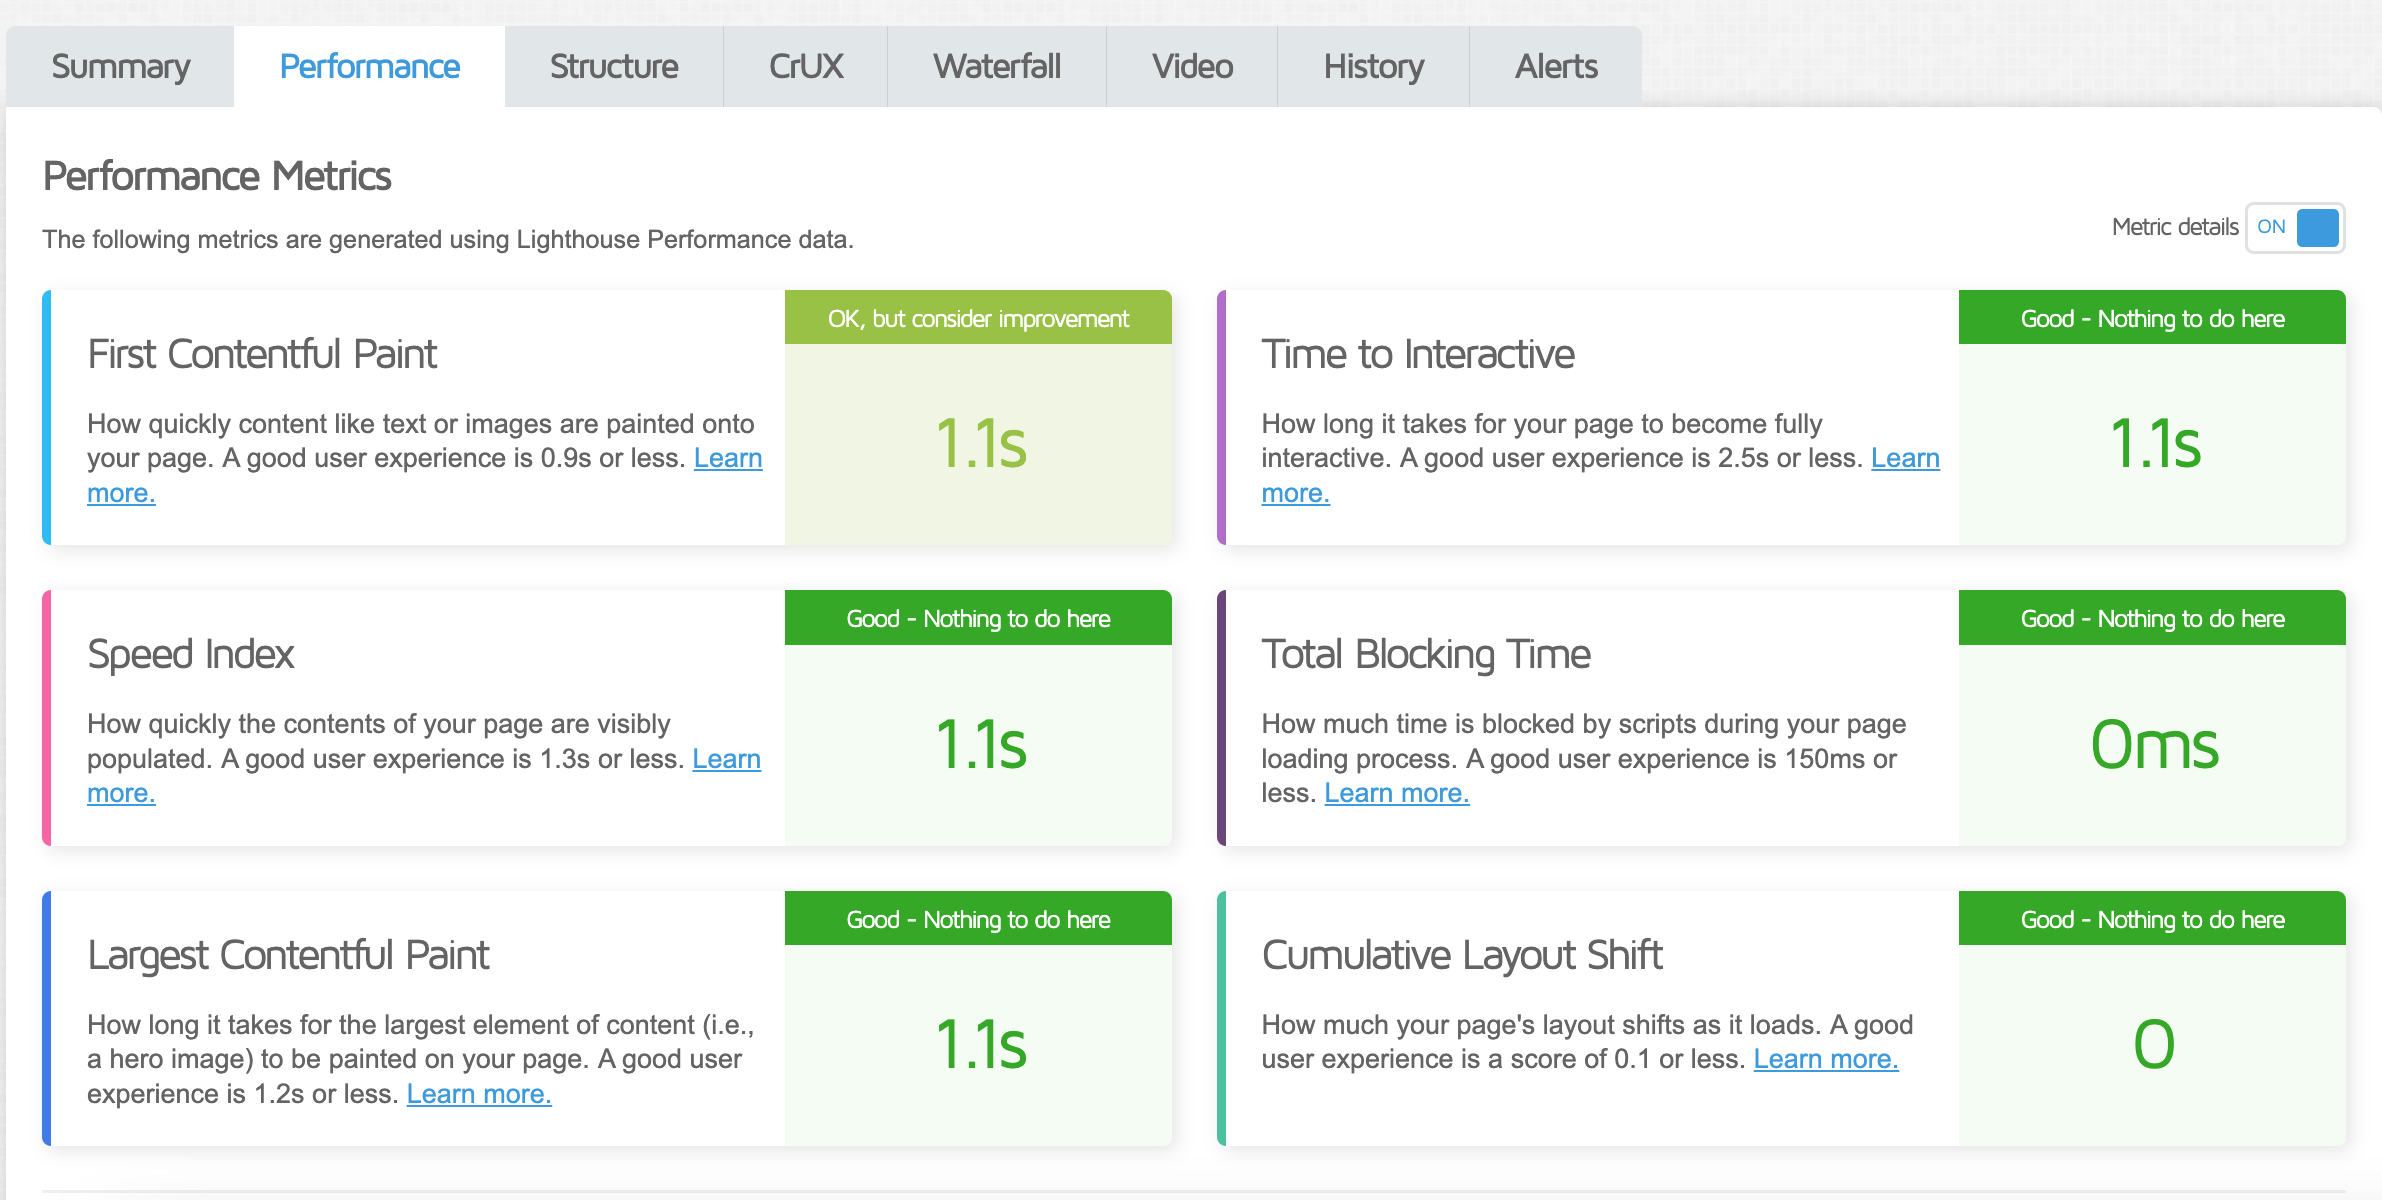
When you’re ready to perform the test, simply click Analyze. Then, you will see the performance scores and the total load time. Beneath the performance scores, you can see eight tabs covering different sections of the report with each consisting of different suggestions to improve your site speed:
- Summary – a high‐level overview of your page’s performance, including overall scores and key metrics at a glance.
- Performance – in‐depth Lighthouse metrics like First Contentful Paint (FCP), Speed Index, and Largest Contentful Paint (LCP), plus recommendations for improving your page speed.
- Structure – highlights your page’s technical health by analyzing factors like HTML, CSS, and JavaScript best practices. Helps you see where site architecture can be optimized.
- CrUX (Chrome User Experience Report) – shows real‐world performance data from Chrome users, giving you insight into how actual visitors experience your site.
- Waterfall – visual breakdown of every network request (images, scripts, etc.) and how long each takes. Useful for spotting slow or blocking resources.
- Video – this tab will show you a video of the entire loading process. So, you can see which elements of the page take more time to load visually. You can also download the video if you want to document the site’s performance on each test.
- History – tracks tests over time, helping you monitor performance improvements or regressions after making site changes.
- Alerts – notifies you when performance criteria you’ve set are met or exceeded, so you can act on issues as soon as they happen.
Easy tips to increase website speed
Now that you’ve learned how your site needs to be improved, let’s apply some of the suggestions provided by GTmetrix.
Enabling GZIP Compression
File size and type can affect the overall load time of a site, since the browser needs to load different file types, such as HTML, CSS, and JavaScript. To solve this problem, you can try using GZIP compression.
Pro Tip
You can check whether your site it enabled by using Small SEO’s Check Gzip Compression tool.
This can also depend on your hosting provider. Hostinger uses LiteSpeed for WordPress sites and has GZIP enabled by default.
However, if your site doesn’t have GZIP compression enabled, you can turn it on by modifying the .htaccess file. Go to the public_html directory of your site with an FTP client like FileZilla, or by using the hPanel’s file manager. Place this code snippet into the file:
<IfModule mod_deflate.c>

AddOutputFilterByType DEFLATE text/plain

AddOutputFilterByType DEFLATE text/html

AddOutputFilterByType DEFLATE text/xml

AddOutputFilterByType DEFLATE text/css

AddOutputFilterByType DEFLATE application/xml

AddOutputFilterByType DEFLATE application/xhtml+xml

AddOutputFilterByType DEFLATE application/rss+xml

AddOutputFilterByType DEFLATE application/javascript

AddOutputFilterByType DEFLATE application/x-javascript

</IfModule>
After saving the file, you can test the site again using the checker, or by running another GTmetrix test and checking the PageSpeed and YSlow tabs.
Alternatively, you can install a WordPress plugin like WP fastest cache. The free version allows you to enable GZIP compression in just a few clicks.
Minify CSS, JavaScript, and HTML
Minifying CSS, Javascript, and HTML is another way to improve loading time. It will remove any unnecessary characters in each file, such as white space characters or newline characters.

You can try minifying web files by using tools like Minify Code. Copy the original code from GTmetrix which can be found in the minifying suggestion section in the PageSpeed or Yslow tabs. Paste the original code to the minification tool to get the optimized version. Then, copy it and overwrite the original text in your site’s directory. You can do so by using an FTP client or a file manager.

Conclusion
GTmetrix is a tool that will help you test your site’s speed performance. Make sure that you improve test accuracy by considering the number of tests you’ll run, the locations, subjects and time.
In this article, you’ve learned what kind of suggestions GTmetrix provides to help you improve site loading speed, and what each test tab means.
Do you have any questions regarding GTmetrix? Let us know in the comment section below!

Jordana is a Senior Content Writer at Hostinger with a background in Information Systems. She has over five years of experience in WordPress and is casually dabbling with PHP and MySQL. Her passion for writing and technology drives her to create tutorials for anyone wanting to build their online presence. Follow her on LinkedIn.


Comments
May 21 2020
Very useful and informative tutorial for GTmetrix
January 12 2022
Thank you for this great post! Great Value! I will bookmark it looking forward to receiving the next coming updates!
January 18 2022
Happy to hear! We've recently updated our piece about website optimization with LiteSpeed Cache that might interest you as well :)